I’m in the habit of always carrying my GPS, recording where I go hiking, biking, or driving. Yesterday, while on a walk, I though that it should be pretty easy when visualizing the accumulated track to use different color for each mode of transportation. So, today I modified my GPS visualizer scripts a bit adding parameters that allow selection by speed range.
On this image my trips are color-coded, based on the track speed:
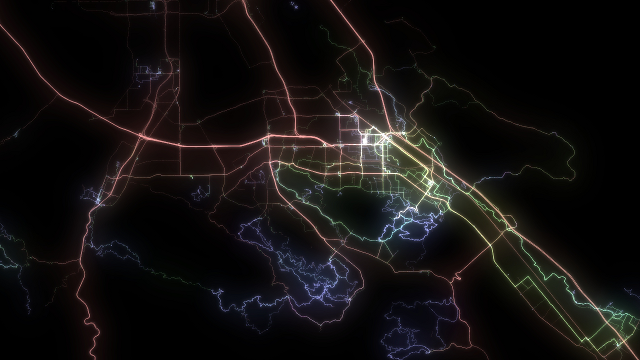
Here, RED is Driving (or rather “likely driving” based on the speed range), GREEN is Biking, and BLUE is Hiking/Walking.
If somebody is interested, the visualizer scripts, some more images, and a sample video can be downloaded from here: http://avtanski.net/projects/gps .
[ Go to project ]